
1.2 TB mortality
Box 1.2.1 summarizes the methods used to produce estimates of TB mortality between 2010 and 2024.
For consistency with international standards (1), a clear distinction is made between deaths from TB in people without HIV (classified as deaths caused by TB) and deaths from TB in people with HIV (classified as deaths caused by HIV, with TB as a contributory cause).
Globally in 2024, there were an estimated 1.08 million deaths among HIV-negative people (95% uncertainty interval [UI]: 0.99–1.18 million) and an estimated 150 000 deaths among people with HIV (95% UI: 120 000–183 000) (Fig. 1.2.1). The combined total was 1.23 million.
Fig. 1.2.1 Global trends in the estimated number of deaths caused by TB (a) and the TB mortality rate (b), 2010–2024
(a) Number
(b) Rate per 100 000 population
Following increases in the estimated number of TB deaths during COVID-related disruptions to TB diagnosis and treatment in 2020 and 2021, numbers have subsequently fallen. There was a 3% reduction between 2023 and 2024 and a 13.8% reduction compared with 2021. The net reduction in the total number of deaths caused by TB between 2015 and 2024 was 29%, still far from the 2025 milestone of the WHO End TB Strategy (a 75% reduction between 2015 and 2025).
In 2024, most of the estimated deaths caused by TB among HIV-negative people occurred in the WHO regions of South-East Asia (40%), Africa (29%) and the Western Pacific (19%), with smaller shares in the Eastern Mediterranean (7.9%), the Americas (2.1%) and Europe (1.4%). Most of the TB deaths among people with HIV occurred in the African Region (Table 1.2.1).
Table 1.2.1 Global and regional estimates of TB mortality, numbers (in thousands) and rates (per 100 000 population) in 2024
| Region or country group | Best estimate | Low | High | Best estimate | Low | High | Best estimate | Low | High | Best estimate | Low | High |
|---|---|---|---|---|---|---|---|---|---|---|---|---|
| African Region | 315 | 264 | 370 | 108 | 79 | 141 | 25 | 21 | 29 | 8.5 | 6.2 | 11 |
| Region of the Americas | 22 | 21 | 24 | 7.8 | 6.8 | 9.0 | 2.1 | 2.0 | 2.3 | 0.75 | 0.65 | 0.86 |
| Eastern Mediterranean Region | 85 | 71 | 99 | 1.3 | 0.30 | 3.0 | 10 | 8.7 | 12 | 0.16 | <0.1 | 0.37 |
| European Region | 15 | 14 | 16 | 3.8 | 2.7 | 5.0 | 1.6 | 1.5 | 1.7 | 0.40 | 0.28 | 0.54 |
| South-East Asia Region | 433 | 360 | 512 | 13 | 9.3 | 16 | 24 | 20 | 28 | 0.69 | 0.51 | 0.89 |
| Western Pacific Region | 211 | 192 | 231 | 17 | 14 | 20 | 9.5 | 8.6 | 10 | 0.75 | 0.62 | 0.90 |
| High TB burden countries | 922 | 830 | 1020 | 117 | 88 | 151 | 18 | 17 | 20 | 2.3 | 1.8 | 3.0 |
| Global | 1080 | 987 | 1180 | 150 | 120 | 183 | 13 | 12 | 14 | 1.8 | 1.5 | 2.2 |
Globally in 2024, 49.7% of the HIV-negative people who died from TB were adult men, 34.4% were adult women and 15.9% were children and young adolescents (aged <15 years) (Fig. 1.2.2).
Of the TB deaths among people with HIV, 51.9% were adult men, 46.6% were adult women and 1.5% were children and young adolescents.
Fig. 1.2.2 Global distribution of estimated TB mortality in HIV-negative people and in people with HIV by age group and sex (female in purple; male in orange), 2024
(a) Among HIV-negative people
Female
Male
(b) Among people with HIV
Female
Male
In 2024, an estimated total of 614 000 adult men (aged ≥15 years) died from TB (95% UI: 407 000–821 000): 537 000 among those HIV-negative (95% UI: 368 000–705 000) and 78 000 among those with HIV (95% UI: 39 000–116 000). An estimated total of 442 000 adult women (aged ≥15 years) died from TB (95% UI: 269 000–615 000): 372 000 among those HIV-negative (95% UI: 243 000–502 000) and 70 000 among those with HIV (95% UI: 26 000–113 000).
In 2024, an estimated total of 174 000 children and young adolescents (<15 years) died from TB (95% UI: 109 000–239 000): 172 000 among those HIV-negative (95% UI: 107 000–236 000) and 2300 among those with HIV (95% UI: 1600–2900). Among HIV-negative children and young adolescents, the estimated number of TB deaths in 2024 was 122 000 among children aged <5 years (95% UI: 71 000–174 000); and 50 000 in older children and young adolescents aged 5–14 years (95% UI: 37 000–62 000).
The latest year for which WHO has published estimates of global deaths by cause is 2021. In that year, TB was the tenth leading cause of death worldwide (Fig. 1.2.3) and the second leading cause of death from a single infectious agent, after COVID-19. In the African and South-East Asia regions, it was the fourth and fifth leading cause of death, respectively.
In 2024, a total of 70 000 deaths from COVID-19 were officially reported to WHO (2). This number does not account for late reporting or underreporting, but it is far below the estimated number of deaths from TB.
Fig. 1.2.3 Top 15 causes of death worldwide in 2021 a,b
b Deaths from TB among people with HIV are officially classified as deaths caused by HIV/AIDS in the International Classification of Diseases.
The estimated number of deaths officially classified as caused by TB (i.e. those among HIV-negative people) in 2024, was almost double the 630 000 (95% UI: 600 000–660 000) caused by HIV/AIDS (Fig. 1.2.4).
Fig. 1.2.4 Estimated number of deaths caused by HIV/AIDS and TB in 2024 a,b
b Deaths from TB among people with HIV are officially classified as deaths caused by HIV/AIDS in the International Classification of Diseases.
Since 2010, deaths from TB among HIV-negative people have fallen much more slowly than deaths caused by HIV and were also more impacted by the COVID-19 pandemic (Fig. 1.2.5).
Fig. 1.2.5 Global trends in the estimated number of deaths caused by TB and HIV (in millions), 2010–2024 a,b
b Deaths from TB among people with HIV are officially classified as deaths caused by HIV/AIDS in the International Classification of Diseases.
The TB mortality rate fell in five of the six WHO regions in 2024 and stabilized in the Region of the Americas (Fig. 1.2.6).
Fig. 1.2.6 Trends in estimated TB mortality rates by WHO region, 2010–2024
Trends in the absolute number of TB deaths at regional level vary (Fig. 1.2.7). The pattern of a fall in the absolute number of deaths caused by TB (including those among people with HIV) until 2019, followed by increases during the COVID-19 pandemic and then declines starting in either 2022 or 2023, is evident in the WHO European, South-East Asia and Western Pacific regions.
In the Eastern Mediterranean Region, an increase in 2020 and 2021 was followed by a decline in 2022 and then by a small increase between 2022 and 2024. In the Region of the Americas, the estimated number of deaths caused by TB peaked in 2022, declined in 2023 and stabilized in 2024. In the African Region, the estimated number of deaths caused by TB has fallen year on year since 2011.
Fig. 1.2.7 Trends in the estimated absolute number of TB deaths in HIV-negative people and people with HIV (in thousands) by WHO region, 2010–2024
The European Region and the African Region are the closest to reaching the 2025 milestone of the End TB Strategy, with reductions of 49% and 46% respectively between 2015 and 2024. The four other regions are still far from the 2025 milestone of the End TB Strategy, with progress up to 2019 set back by disruptions during the COVID-19 pandemic and its aftermath.
Trends in TB deaths by income group are shown in (Fig. 1.2.8).
Fig. 1.2.8 Trends in the estimated absolute number of TB deaths in HIV-negative people and people with HIV (in thousands) by income group, 2010–2024
The regional distribution of TB deaths by age and sex in 2024 varies by WHO region (Fig. 1.2.9).
Fig. 1.2.9 Regional distribution of estimated TB mortality in HIV-negative people and people with HIV by age group and sex (female in purple; male in orange), 2024
(a) Female
(b) Male
Progress in reducing the total number of deaths caused by TB (among people with and without HIV) at country level is highly variable (Fig. 1.2.10). A total of 65 countries have surpassed the first (2020) milestone of the End TB Strategy, which was a 35% reduction compared with the baseline of 2015. At the other extreme, the number of deaths caused by TB has increased in some countries, mainly related to disruptions during the COVID-19 pandemic. This increase has been particularly pronounced in the Region of the Americas.
Fig. 1.2.10 Change (%) in the estimated number of deaths caused by TB among HIV-negative people and people with HIV, 2024 compared with 2015

Trends in the total number of deaths caused by TB (among people with and without HIV) in the 30 high TB burden countries are also highly variable. Between 2019 and 2021, striking increases are estimated to have occurred in countries that experienced major shortfalls in TB notifications in 2020 and 2021 (e.g. Indonesia, Myanmar, the Philippines), while in others previous declines have slowed or stabilized.
In 2024, the best estimate of the total number of deaths caused by TB suggested that the 2025 milestone of the WHO End TB Strategy (a 75% reduction by 2025, compared with 2015) was close to being reached in five high TB burden countries: the Central African Republic, Kenya, Nigeria, the United Republic of Tanzania and Zambia (Fig. 1.2.11).
Fig. 1.2.11 Trends in the estimated absolute number (in thousands) of deaths caused by TB among HIV-negative people and people with HIV in the 30 high TB burden countries, 2010–2024
Of the three global TB watchlist countries, the Russian Federation is well on the way to reaching the 2025 milestone (Fig. 1.2.12), with a net reduction of 61% between 2015 and 2024.
Fig. 1.2.12 Trends in the estimated absolute number (in thousands) of deaths caused by TB among HIV-negative people and people with HIV in the three global TB watchlist countries, 2010–2024
There is considerable national variation in the TB mortality rate; in 2024, most of the countries with the highest rates were in the African Region (Fig. 1.2.13).
Fig. 1.2.13 Estimated TB mortality rates in HIV-negative people, 2024

There is also considerable variation in the case fatality rate (CFR) i.e. the estimated proportion of people who develop TB that die from the disease (Fig. 1.2.14). Globally, the CFR was 11.5% in 2024, down from 11.8% in 2023 and 12.6% in 2022 (and below the pre-pandemic level of 13.6% in 2019).
Fig. 1.2.14 Estimates of the case fatality rate (CFR), including HIV-negative people and people with HIV, 2024

Box 1.2.1
Methods used by WHO to estimate TB mortality
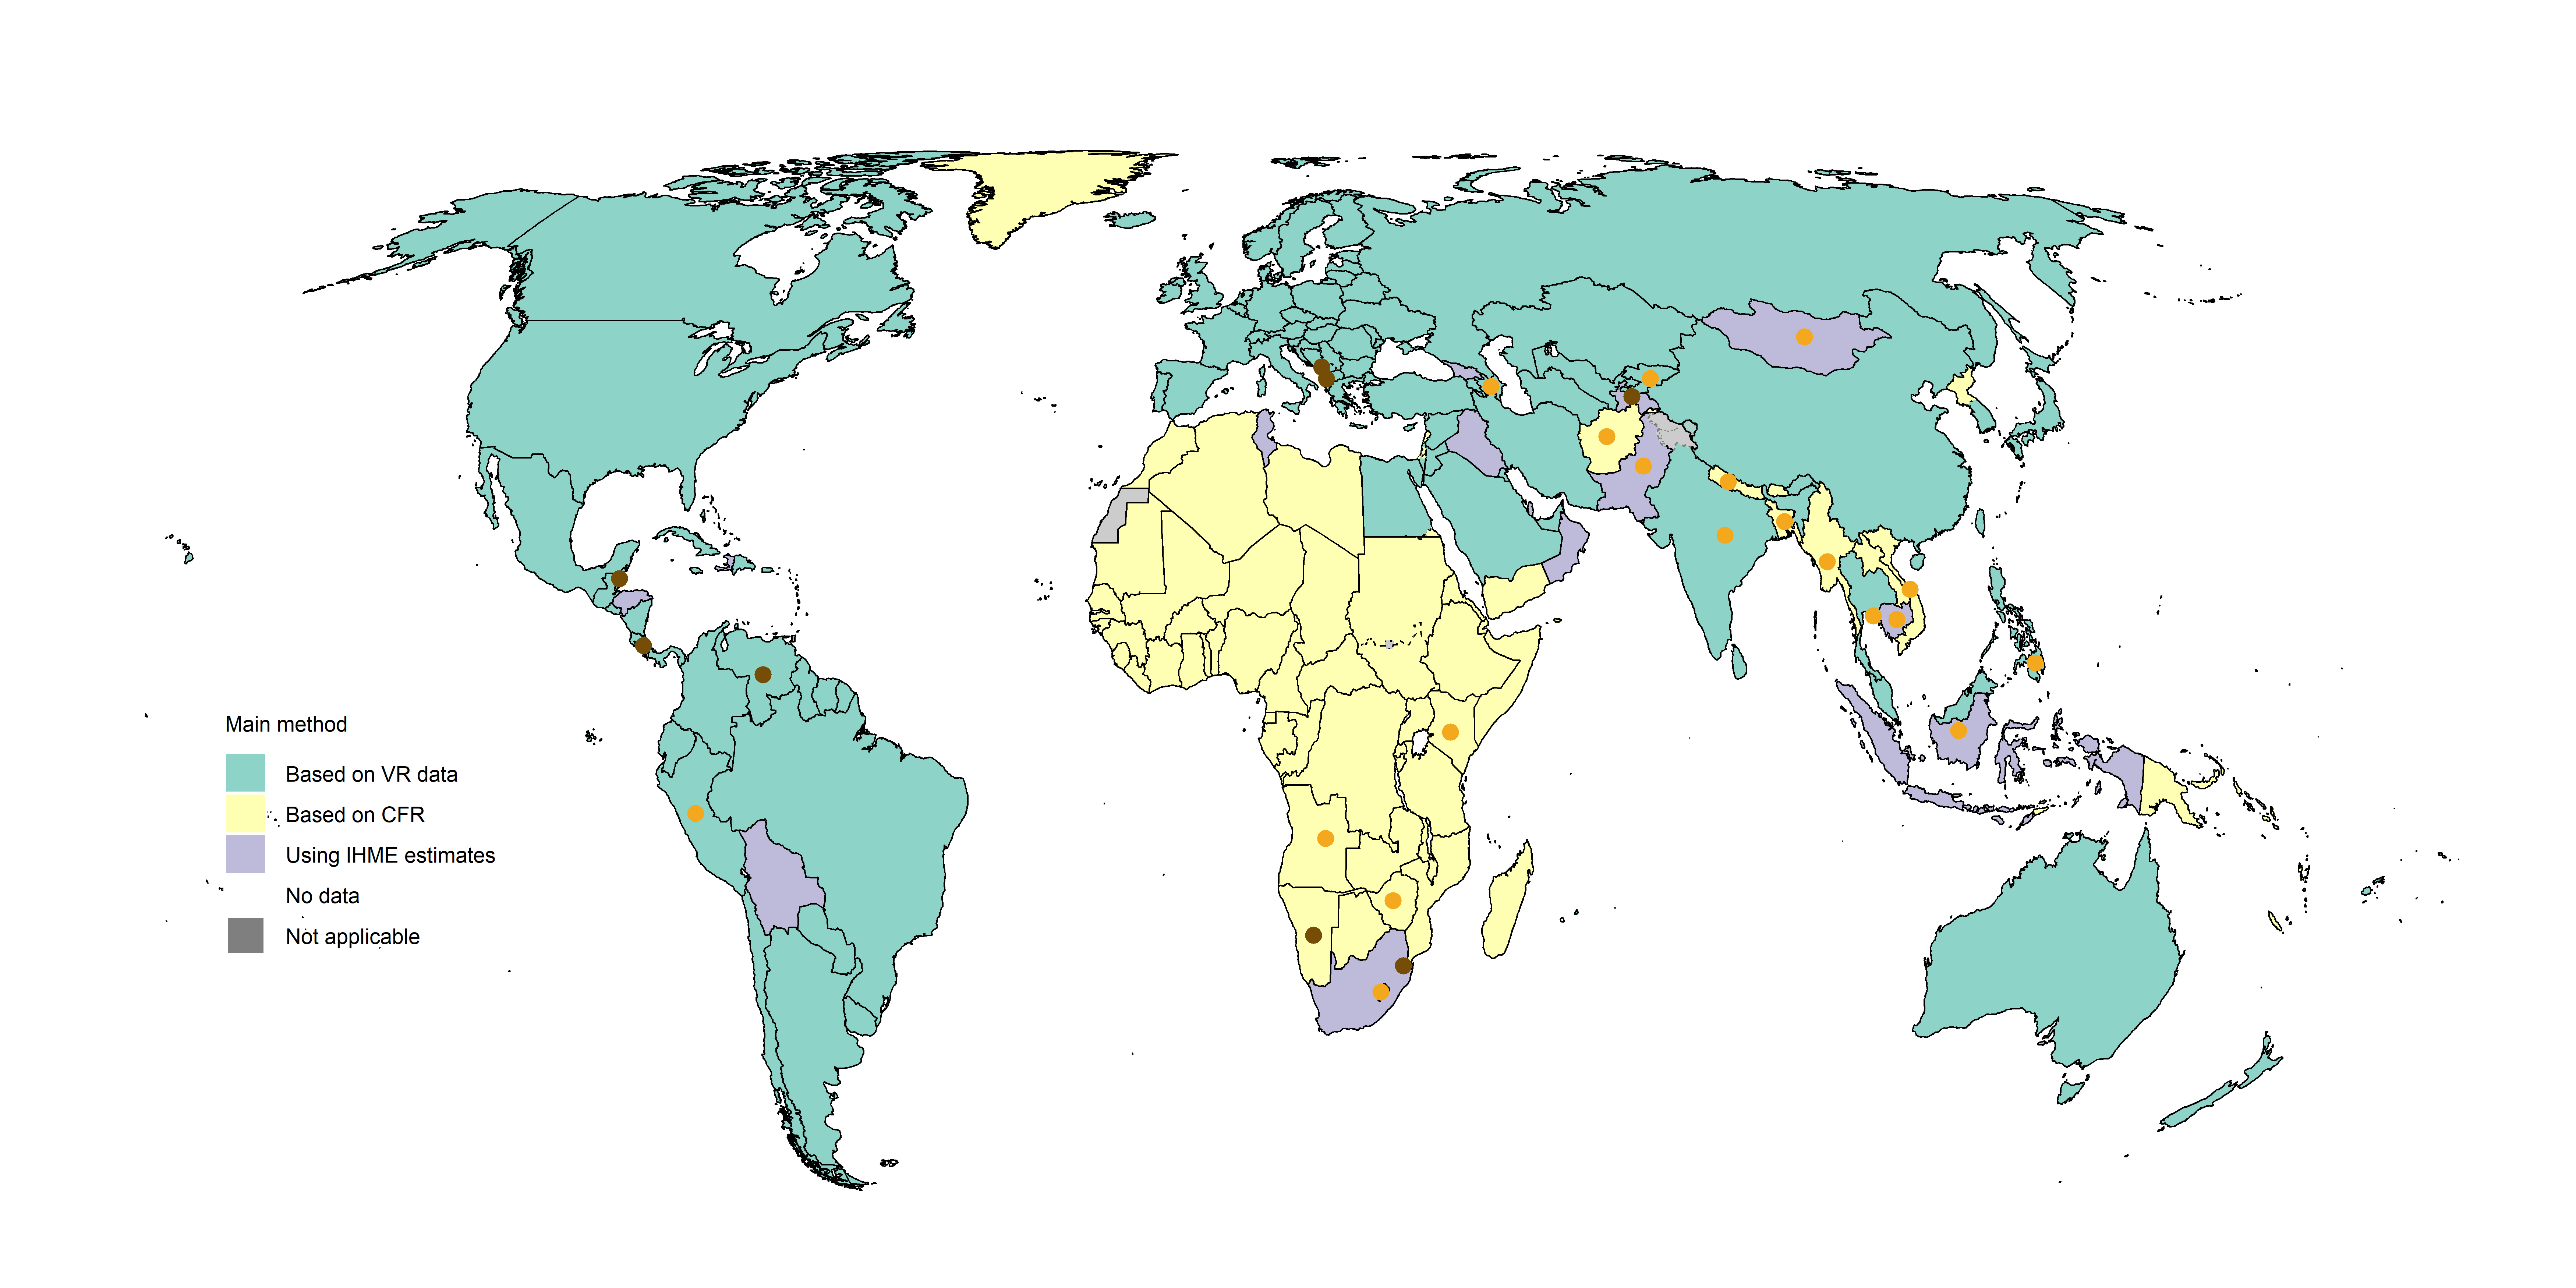
The main methods used by WHO to estimate TB mortality at country level in the period 2010–2024 are shown in Fig. 1.2.15. These methods adhere to global guidelines for accurate and transparent reporting of health estimates (4) and are described in detail in a technical appendix.
The methods used for the period 2010–2024 can be summarized as follows:
For 108 countries, estimates of the number of deaths caused by TB among HIV-negative people were based on data on causes of death from national or sample vital registration (VR) systems that have been officially reported to WHO. For India, officially published data from the sample registration system (SRS) were used (5); detailed data from the SRS have not been officially reported to WHO. These 108 countries collectively accounted for 35% of the estimated global number of deaths (among HIV-negative people) caused by TB in 2024.
For 15 countries, estimates published by the Institute of Health Metrics and Evaluation (IHME) were used (6). These are based on analyses of VR data as well as additional data. These 15 countries collectively accounted for 20% of the estimated global number of deaths (among HIV-negative people) caused by TB in 2024.
For the remaining 92 countries, TB mortality among HIV-negative people was estimated indirectly as the product of TB incidence and the CFR. These 92 countries collectively accounted for 45% of the estimated global number of deaths (among HIV-negative people) caused by TB in 2024.
For all countries, TB mortality among people with HIV was estimated as the product of TB incidence and the CFR, with the latter accounting for the protective effect of antiretroviral treatment (ART).
To produce estimates of TB mortality in the period 2020–2024, country or region-specific dynamic models were developed for the 27 countries with the biggest absolute reductions in TB notifications during the COVID-19 pandemic (when these reductions departed from pre-2020 trends).
For all other countries and areas, estimates for 2020–2024 were based on the same methods as those used up to 2019.
The orange dots show countries for which a country-specific dynamic model has been used (n=19) and the brown dots show countries for which a region-specific dynamic model has been used (n=8) . These two groups of countries accounted for 59% and 0.5% of the estimated total number of deaths caused by TB in 2024, respectively.
Fig. 1.2.15 Main methods used to estimate TB mortality in HIV-negative people, 2010–2024
Country-specific details are available in the Global tuberculosis report app and country profiles.
Note : All of the percentage reductions or increases referred to in the text of this webpage were calculated based on unrounded numbers, as opposed to the rounded numbers that appear in the interactive graphics.
References
International statistical classification of diseases and health related problems (The) ICD-10. Geneva: World Health Organization; 2016 (https://icd.who.int/browse10/2016/en).
Coronavirus (COVID-19) dashboard. Geneva: World Health Organization. (https://data.who.int/dashboards/covid19/cases).
AIDS info [website]. 2024 (http://aidsinfo.unaids.org/).
Guidelines for Accurate and Transparent Health Estimates Reporting (GATHER) [website]. Geneva: World Health Organization; 2021 (http://gather-statement.org/).
Global tuberculosis report 2023. Geneva: World Health Organization; 2023 (https://iris.who.int/handle/10665/373828). License: CC BY-NC-SA 3.0 IGO.
GBD results tool [website]. Global Health Data Exchange; 2020 (http://ghdx.healthdata.org/gbd-results-tool).
General disclaimers
The designations employed
and the presentation of the material in this publication do not imply
the expression of any opinion whatsoever on the part of WHO concerning
the legal status of any country, territory, city or area or of its
authorities, or concerning the delimitation of its frontiers or
boundaries. Dotted and dashed lines on maps represent approximate border
lines for which there may not yet be full agreement.